Four Golden Signals Of Monitoring: Site Reliability Engineering (SRE) Metrics
Golden Signal Monitoring using FastAPI on k8s
Golden Signals were first introduced by Google in the context of Site Reliability Engineering (SRE) practices. The concept was originally presented in a talk by Google software engineers, Dave Rensin and Kevin Smathers, at the 2016 O’Reilly Velocity Conference. The idea behind Golden Signals was to provide a set of key performance indicators (KPIs) that could be used to measure and monitor the health of complex, distributed systems.
Golden Signals were introduced as a way to help SRE teams focus on what really matters in terms of system reliability and performance. Instead of relying on a large number of metrics and alarms that could be difficult to interpret, Golden Signals provide a simple and easy-to-understand set of metrics that can be used to quickly assess the health of a system.
Since their introduction, Golden Signals have become widely adopted in the SRE community and are considered a best practice for monitoring and managing the health of distributed systems. While the original Golden Signals were focused on latency, traffic, errors, and saturation metrics, some organizations have adapted the concept to include additional metrics that are specific to their systems and use cases. However, the core idea of using a small set of KPIs to measure and monitor system health remains at the heart of the Golden Signals concept.
What are Golden Signals?
Golden Signals are a set of four key metrics that SREs use to measure the health of their systems. These signals include:
- Latency — Latency measures the time it takes for a system to respond to a request. High latency can indicate that the system is overloaded or experiencing other performance issues.

The Prometheus query histogram_quantile(0.95, sum(rate(http_request_duration_seconds_bucket{job="fastapi-app"}[5m])) by (le, method, endpoint)) is used to calculate the 95th percentile latency for the HTTP requests made to a FastAPI application that is instrumented with Prometheus using histogram metrics.
The query calculates the sum of the rate of http_request_duration_seconds_bucket metric values (which represent the number of requests that fall into specific latency buckets) over the last 5 minutes, grouped by latency (le), HTTP method, and endpoint. The histogram_quantile function then uses these values to calculate the 95th percentile latency for each HTTP method and endpoint combination.
2. Traffic — Traffic measures the amount of data or requests that are flowing through the system. High traffic can indicate that the system is experiencing high demand or that there are issues with the system’s capacity.

The Prometheus query rate(http_requests_total{job="fastapi-app"}[$__rate_interval]) calculates the per-second rate of HTTP requests made to a FastAPI application that is instrumented with Prometheus using a counter metric.
The query uses the rate function to calculate the per-second rate of increase in the http_requests_total counter metric, which counts the total number of HTTP requests made to the FastAPI application. The job="fastapi-app" label selector filters the metric data to only include data from the FastAPI application job.
The $__rate_interval variable is a template variable that represents the duration over which to calculate the rate. The value of this variable is set by the user in the Prometheus query interface and determines the time range over which the rate is calculated.
For example, if the user sets the value of $__rate_interval to 5m, the query will calculate the per-second rate of HTTP requests over the last 5 minutes. This query can be used to monitor the traffic to a FastAPI application and identify patterns or anomalies in request volume over time.
3. Errors — Errors measure the number of errors that occur within the system. High error rates can indicate that there are bugs or other issues within the system.
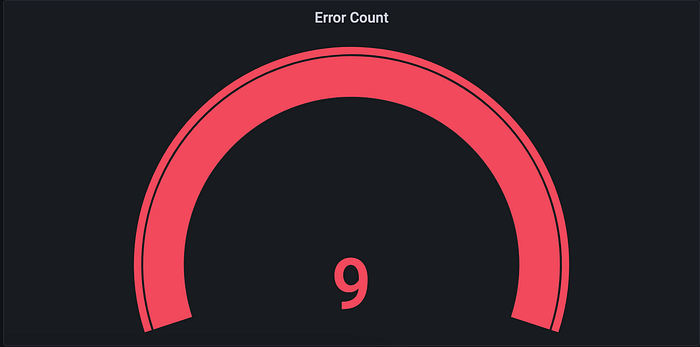
The Prometheus query http_requests_total {endpoint="/generate_error", http_status="500"} retrieves the total number of HTTP requests made to the "/generate_error" endpoint of a web application that is instrumented with Prometheus and resulted in a HTTP status code of 500 (Internal Server Error).
This query uses the http_requests_total counter metric, which counts the total number of HTTP requests made to the web application. The query filters the metric data to only include requests made to the "/generate_error" endpoint by specifying the endpoint="/generate_error" label selector. Additionally, the query filters the data to only include requests that resulted in a HTTP status code of 500 by specifying the http_status="500" label selector.
By running this query, you can gain insight into how often errors are occurring in your web application and which endpoints are most prone to errors. This information can help you identify and fix issues in your application, improve its reliability, and ensure a better experience for your users.
4. Saturation — Saturation measures the resource utilization of the system. High saturation can indicate that the system is running out of resources, such as CPU or memory.
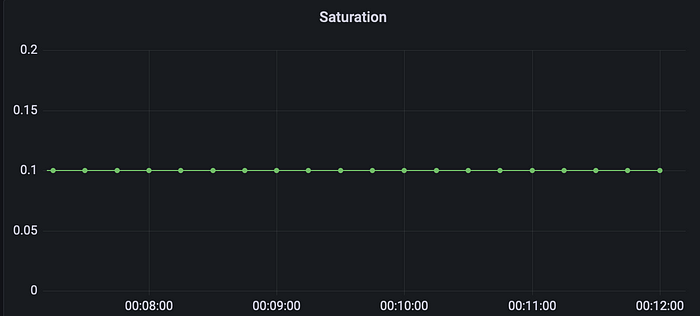
The Prometheus query clamp_max(active_requests{job="fastapi-app"} / 10, 1) is used to calculate the ratio of active requests to the maximum number of concurrent requests, and to limit the value of this ratio to a maximum of 1.
This query uses the active_requests gauge metric to retrieve the current number of active requests in a FastAPI application that is instrumented with Prometheus. The job="fastapi-app" label selector filters the metric data to only include data from the FastAPI application job.
The query then divides the number of active requests by 10, which represents the maximum number of concurrent requests that the system can handle. The clamp_max function is then used to limit the value of this ratio to a maximum of 1. This means that if the ratio of active requests to the maximum number of concurrent requests is greater than 1, the query will return a value of 1.
By using this query, you can monitor the saturation of your system and identify when it is being overloaded with requests. If the ratio of active requests to the maximum number of concurrent requests approaches 1, it may be necessary to scale up the system to handle the increased demand. This query can help you ensure that your system remains reliable and performant under heavy load.
Why are Golden Signals important?
Golden Signals are important because they provide SREs with a clear understanding of how their systems are performing. By measuring and monitoring these key metrics, SREs can quickly identify issues and take corrective action before they become critical. This helps to ensure that systems remain reliable, scalable, and performant, even as they grow in complexity.
How can Golden Signals be used to improve system reliability?
Golden Signals can be used in several ways to improve system reliability:
- Proactive Monitoring — By monitoring Golden Signals on a continuous basis, SREs can identify issues before they become critical. This allows them to take proactive steps to prevent downtime or other performance issues.
- Capacity Planning — Golden Signals can be used to identify when a system is reaching its capacity limits. By monitoring traffic and saturation metrics, SREs can make informed decisions about when to scale up or scale out the system to meet demand.
- Root Cause Analysis — When an issue occurs within a system, SREs can use Golden Signals to help identify the root cause of the issue. By looking at the latency, traffic, errors, and saturation metrics, SREs can gain insight into what went wrong and take steps to prevent similar issues from occurring in the future.
It’s also important to understand how these can be implemented in practice. One way to implement Golden Signals is through the use of monitoring tools and libraries that support them, such as Prometheus. In this code example, we have a Python FastAPI application that uses Prometheus to implement Golden Signals.
from fastapi import FastAPI, Request, HTTPException, Response
from prometheus_client import Counter, Gauge, Histogram, generate_latest, CONTENT_TYPE_LATEST
from starlette.responses import StreamingResponse
import time

app = FastAPI()

# Define Prometheus metrics
http_requests_total = Counter(
    "http_requests_total",
    "Total number of HTTP requests",
    ["method", "endpoint", "http_status"]
)
http_request_duration_seconds = Histogram(
    "http_request_duration_seconds",
    "HTTP request duration in seconds",
    ["method", "endpoint"]
)
http_request_size_bytes = Histogram(
    "http_request_size_bytes",
    "HTTP request size in bytes",
    ["method", "endpoint"]
)
http_response_size_bytes = Histogram(
    "http_response_size_bytes",
    "HTTP response size in bytes",
    ["method", "endpoint"]
)
active_requests = Gauge(
    "active_requests",
    "Number of active requests"
)
error_counter = Counter(
    "error_counter",
    "Total number of HTTP errors",
    ["method", "endpoint", "http_status"]
)

@app.middleware("http")
async def record_request_start_time(request: Request, call_next):
    request.state.start_time = time.time()
    response = await call_next(request)
    return response

@app.middleware("http")
async def record_request_end_time(request: Request, call_next):
    response = await call_next(request)
    latency = time.time() - request.state.start_time
    http_request_duration_seconds.labels(
        request.method, request.url.path
    ).observe(latency)
    http_request_size_bytes.labels(
        request.method, request.url.path
    ).observe(request.headers.get("Content-Length", 0))
    if isinstance(response, StreamingResponse):
        response_size = 0
    else:
        response_size = len(response.content)
    http_response_size_bytes.labels(
        request.method, request.url.path
    ).observe(response_size)
    http_requests_total.labels(
        request.method, request.url.path, response.status_code
    ).inc()
    return response

@app.middleware("http")
async def increment_counter(request: Request, call_next):
    active_requests.inc()
    response = await call_next(request)
    active_requests.dec()
    return response

@app.middleware("http")
async def log_saturation(request: Request, call_next):
    max_concurrent_requests = 10  # set the maximum number of concurrent requests
    saturation_ratio = active_requests._value._value / max_concurrent_requests
    print(f"Saturation: {saturation_ratio}")
    return await call_next(request)

@app.middleware("http")
async def increment_error_counter(request: Request, call_next):
    try:
        response = await call_next(request)
        return response
    except HTTPException as e:
        error_counter.labels(
            request.method, request.url.path, e.status_code
        ).inc()
        print(f"Incremented error counter for {request.method} {request.url.path} {e.status_code}")
        raise e


@app.get("/")
async def root():
    return {"message": "Hello, World!"}


@app.get("/generate_traffic")
async def generate_traffic():
    for i in range(100):
        response = await root()
        print(response)
    return {"message": "Generated traffic successfully."}


@app.get("/generate_error")
async def generate_error():
    raise HTTPException(status_code=500, detail="Generated an error.")


@app.get("/metrics")
async def metrics():
    return Response(content=generate_latest(), media_type=CONTENT_TYPE_LATEST)
requirements.txt
anyio==3.6.2
click==8.1.3
fastapi==0.92.0
h11==0.14.0
idna==3.4
prometheus-client==0.16.0
pydantic==1.10.5
sniffio==1.3.0
starlette==0.25.0
typing_extensions==4.5.0
uvicorn==0.20.0
Deployment to k8s
Once you have implemented Golden Signals in your FastAPI application using Prometheus, you may want to deploy it to a Kubernetes cluster to ensure scalability and high availability. The following Kubernetes manifest files can be used to deploy your FastAPI application and Grafana dashboard to the cluster:
fastapi-app.yaml
# @format

apiVersion: apps/v1
kind: Deployment
metadata:
  name: fastapi-app
spec:
  selector:
    matchLabels:
      app: fastapi-app
  replicas: 2
  template:
    metadata:
      labels:
        app: fastapi-app
      annotations:
        prometheus.io/scrape: "true"
        prometheus.io/path: "/"
        prometheus.io/port: "80"
    spec:
      containers:
        - name: fastapi-app
          image: rtiwariops/fastapi-app:v1
          ports:
            - containerPort: 80
---
apiVersion: v1
kind: Service
metadata:
  name: fastapi-app
spec:
  selector:
    app: fastapi-app
  ports:
    - name: http
      protocol: TCP
      port: 80
      targetPort: 80
grafana.yaml
# @format

apiVersion: apps/v1
kind: Deployment
metadata:
  name: grafana
spec:
  selector:
    matchLabels:
      app: grafana
  replicas: 1
  template:
    metadata:
      labels:
        app: grafana
    spec:
      containers:
        - name: grafana
          image: grafana/grafana:latest
          ports:
            - containerPort: 3000
---
apiVersion: v1
kind: Service
metadata:
  name: grafana
spec:
  selector:
    app: grafana
  ports:
    - name: http
      protocol: TCP
      port: 3000
      targetPort: 3000
prometheus.yaml
apiVersion: v1
kind: Service
metadata:
  name: prometheus
spec:
  selector:
    app: prometheus
  ports:
    - name: web
      port: 9090
      targetPort: 9090
---
apiVersion: apps/v1
kind: Deployment
metadata:
  name: prometheus
spec:
  selector:
    matchLabels:
      app: prometheus
  replicas: 1
  template:
    metadata:
      labels:
        app: prometheus
    spec:
      containers:
      - name: prometheus
        image: prom/prometheus:v2.28.1
        ports:
        - name: web
          containerPort: 9090
        command:
        - "/bin/prometheus"
        args:
        - "--config.file=/etc/prometheus/prometheus.yml"
        volumeMounts:
        - name: config-volume
          mountPath: /etc/prometheus
      volumes:
      - name: config-volume
        configMap:
          name: prometheus-config
In conclusion, Golden Signals are a key tool in the SRE toolbox. By measuring and monitoring latency, traffic, errors, and saturation metrics, SREs can ensure that their systems remain reliable, scalable, and performant, even in the face of increasing complexity and demand.
Complete code can be found here: https://github.com/PolyCloudNative/Golden-Rule-Demo